THE SHORT ANSWER
The key idea, first.
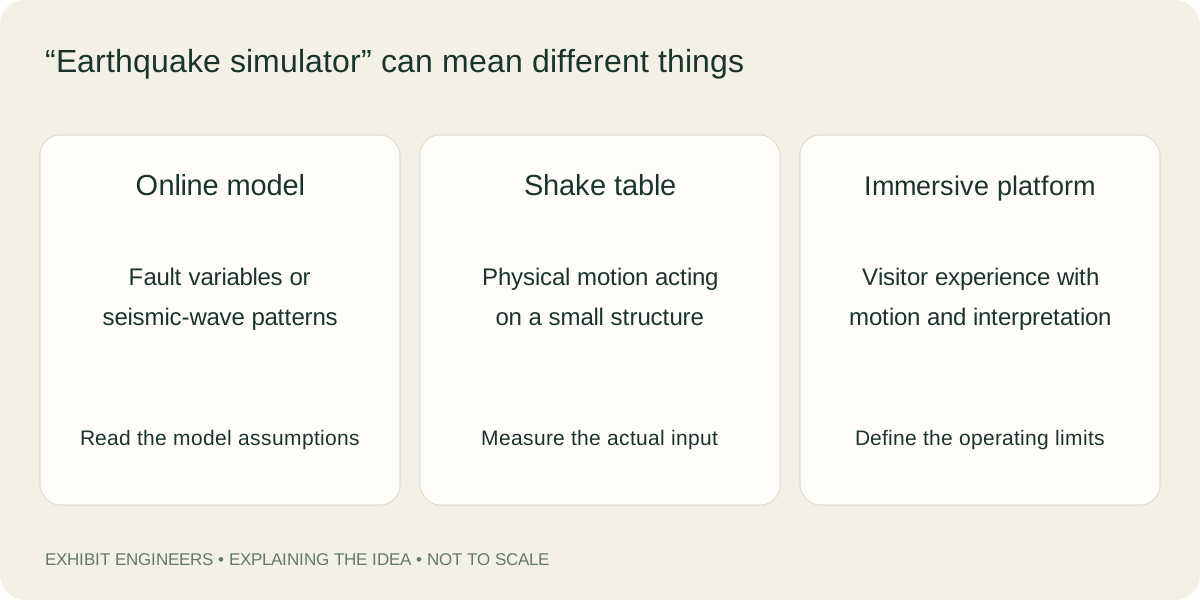
Earthquake simulators represent selected processes. Online models explore fault inputs, event maps organize observations, and shake tables move physical models. Immersive platforms combine motion with a scene. The apparent strength of platform motion does not directly establish an earthquake magnitude.
- Distinguish a source model, an event visualization and a physical shaking demonstration.
- Separate earthquake magnitude from shaking intensity at a location.
- Plan a fair classroom comparison without treating a model result as building certification.
WATCH & NOTICE
Look closely at the demonstration.
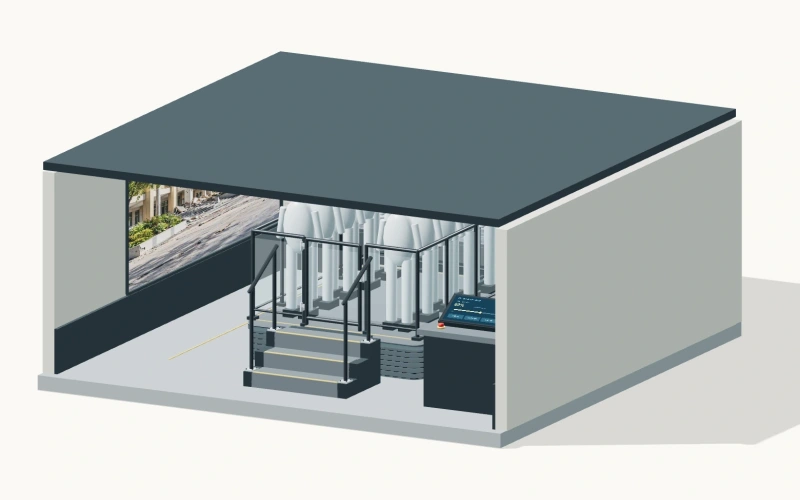
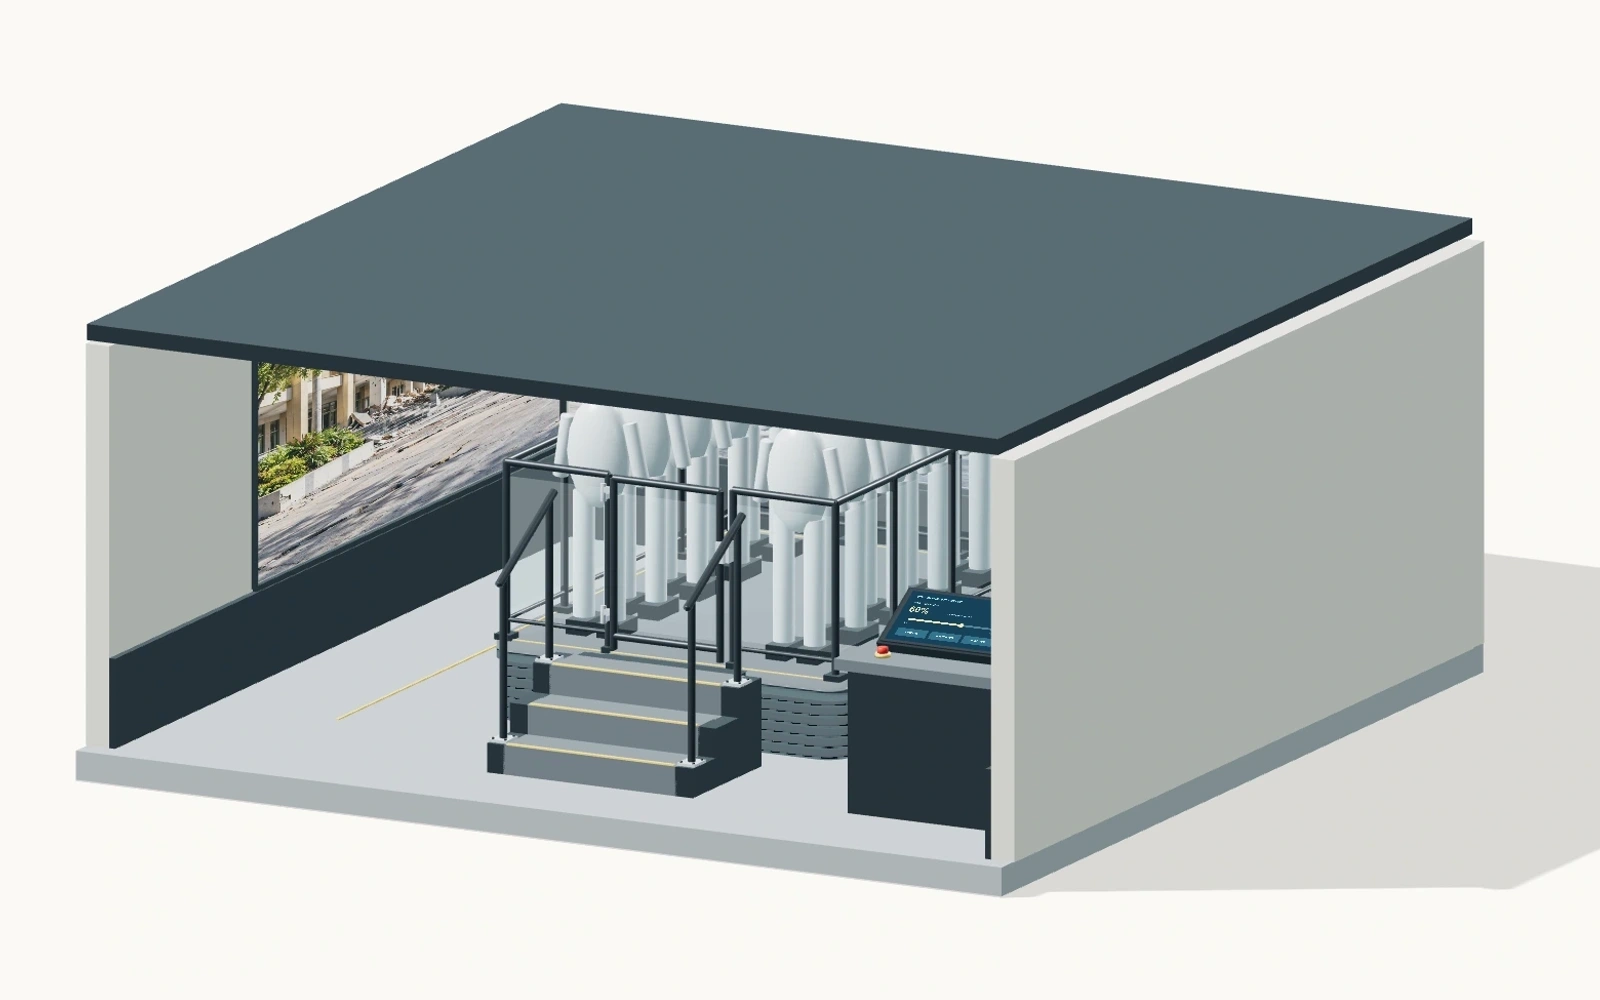
The Immersive Earthquake Platform video is a 3D concept presentation of a proposed room and platform.
Locate the platform
Find the central platform, surrounding barrier and illustrated access route.
Separate image and motion
Identify the wall-image areas. How does a presented scene differ from measured ground movement?
Read the proposal scope
Find the captions about intended equipment and agreeing final specifications.
About this video reference
This is a project concept, not footage of a verified operating installation. It does not establish achieved acceleration, reproduced magnitude, payload, safety certification or a completed operating programme.
01 / EXPLAINING THE IDEA
An online model can ask what makes a larger earthquake
IRIS's EQSimulator lets users vary fault length, depth, slip and rigidity, then calculate an estimated magnitude. It is a source-parameter model: the user changes quantities associated with the fault and examines the calculated result. Nothing needs to shake in the classroom for this to be a useful earthquake investigation.[1]
Begin by predicting what will happen when one input changes while the others stay fixed. Record the initial and revised values with both outputs. The important distinction is between a value chosen by the learner and a value calculated by the model. An on-screen estimate is an exploration of that model's relationships, not a forecast of the next earthquake.
02 / EXPLAINING THE IDEA
An earthquake map answers a different question
Concord Consortium's Seismic Explorer organizes earthquake and other Earth-science data. Its published guide describes circles whose size represents magnitude and whose color represents depth, together with cross-section views. These representations help learners investigate the distribution of events rather than generate a moving-floor experience. A colored circle is a data symbol, not the physical size of the rupture.[2]
Choose a region and ask where deeper events appear relative to shallower ones. Read the legend before interpreting colors, and keep the time interval in view when comparing patterns. An apparent gap might reflect a filter or the selected period. Describing a pattern and testing an explanation for that pattern are separate steps in the investigation.
03 / EXPLAINING THE IDEA
A shake table puts a structure into motion
A classroom shake table moves the support beneath a small structure so observers can compare its response. The Observatory Science Centre & Museum describes an exhibit where visitors build with magnetic pieces, start the shaking, and revise their design. That is a physical design-and-test activity, with a different purpose from changing fault parameters online.[3]
For a classroom comparison, draw two proposed structures before building either one. State which feature differs, such as the arrangement of bracing, and decide what counts as the outcome: visible sway, a separated connection or remaining upright. Keep a sketch of the unchanged features as well. This makes a revision explainable even when neither model survives a trial.
04 / EXPLAINING THE IDEA
Magnitude is not a platform's shake setting
USGS distinguishes an earthquake's magnitude from the intensity of shaking at a location. Magnitude characterizes the earthquake source. Intensity varies across the affected area because distance, surface geology and other conditions differ. Consequently, one event can produce many local shaking experiences. An earthquake's single magnitude does not prescribe one universal motion for every observer.[4]
A platform is better described through the motion it actually produces and the programme used to drive it. A label such as 'strong' supplies less information than a measured motion history. Matching one earthquake experience requires a defined reference and comparison method; the platform's apparent movement cannot establish a magnitude by itself. This remains true when the accompanying visuals are convincing.[4]
05 / EXPLAINING THE IDEA
An immersive platform combines several representations
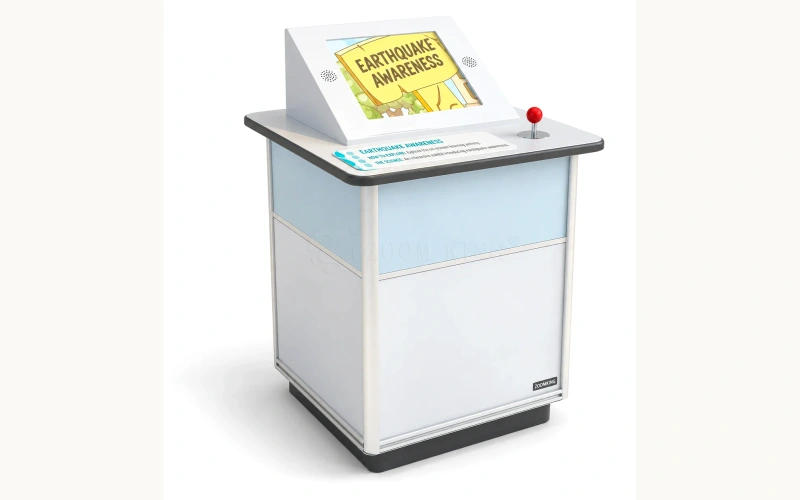
The featured Immersive Earthquake Platform presentation shows a proposed central platform within a room-scale visual arrangement. Its captions and access views explain a design intention. They do not document a completed installation passing a measured test. The separate Earthquake Awareness product record is a catalogue rendering; it likewise cannot establish an operating performance from appearance.
These distinctions make the science discussion more precise. Ask which part of an immersive experience represents physical movement, which presents a visual scene, and which supplies explanatory information. The following comparison separates the questions these formats can support. A project may combine them, but a combined experience still needs each representation and its limits to be explained.
| Format | A useful question |
|---|---|
| Source-parameter model | How does a selected input affect the estimate? |
| Event visualization | Where and when were events recorded? |
| Classroom shake table | How does this model structure respond? |
| Immersive platform | Which scene and motion are being represented? |
06 / EXPLAINING THE IDEA
Make the learning result larger than the spectacle
Assign three roles: designer, observer and recorder. Agree the question and starting condition. If a hand-driven table cannot repeat the same motion, record that uncertainty. One structure surviving longer may suggest a useful idea, but it does not isolate the cause when the input also changed.
Finish with a claim limited to the trial: under the recorded classroom conditions, this model behaved in this way. Then name a further comparison that would strengthen the explanation. The same discipline works for an immersive exhibit: ask what the experience demonstrates, what its labels explain and what would require a separate instrumented test. Educational models support investigation; a model surviving a demonstration does not certify a full-size building.
Common questions.
Is every online earthquake tool a shake-table simulator?
No. IRIS EQSimulator explores source parameters; Seismic Explorer visualizes event data. Neither is the same activity as physically shaking a model structure.[1][2]
Does a larger magnitude mean identical shaking everywhere?
No. USGS explains that local intensity varies with location and conditions even though the event has one magnitude.[4]
Does the concept video show a certified operating platform?
No. It presents a proposed equipment arrangement. Performance and acceptance requirements need separate project evidence.
SCIENCE & FURTHER READING
Follow the sources.
Read the original scientific explanations and teaching resources behind this article.
- IRIS: EQSimulator
The actual online source-parameter activity and its fault inputs; no earthquake forecasting claim.
- Concord Consortium: Observe seismic and volcanic activity with Seismic Explorer
Developer's explanation of event symbols, depth, magnitude and cross sections; a visualization rather than a physical platform.
- Observatory Science Centre & Museum: Shake it off!
An institution's own build-and-test exhibit. Its magnetic pieces and controls are not assigned to a Exhibit Engineers product.
- USGS: Earthquake Magnitude, Energy Release, and Shaking Intensity
Source magnitude, location-dependent intensity and factors affecting shaking; no invented platform-to-magnitude equivalence.
Editorial: Exhibit Engineers science & exhibit team. Scientific references are cited for the explanations; product configuration details follow the linked exhibit records.