THE SHORT ANSWER
The key idea, first.
Ocean currents are directed movements of seawater. Winds, tides and differences in water density help drive them; Earth's rotation and the shape of coasts and the seafloor influence their paths. Temperature and salinity affect seawater density and help explain deep circulation. A touchscreen can introduce these relationships, but its imagery is a representation, not a physical measurement of ocean mixing or a tank experiment.
- Identify several drivers and influences of ocean circulation.
- Explain how temperature and salinity can affect relative seawater density.
- Distinguish an interactive representation from a physical experiment and from ocean observations.
WATCH & NOTICE
Look closely at the demonstration.
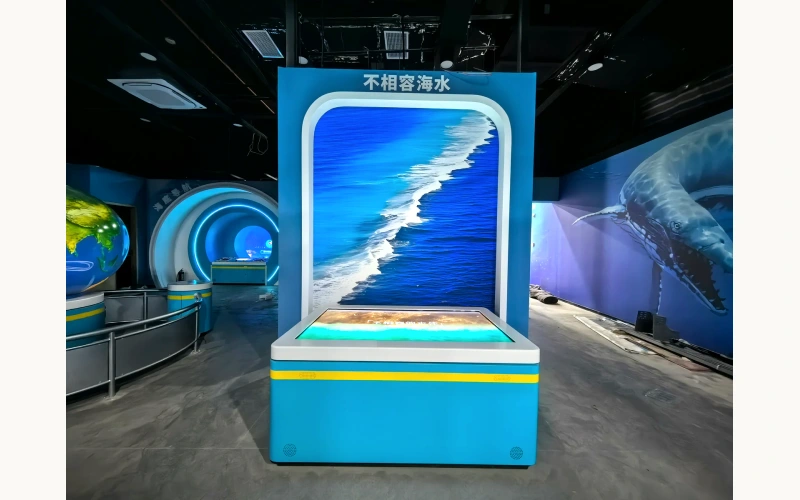
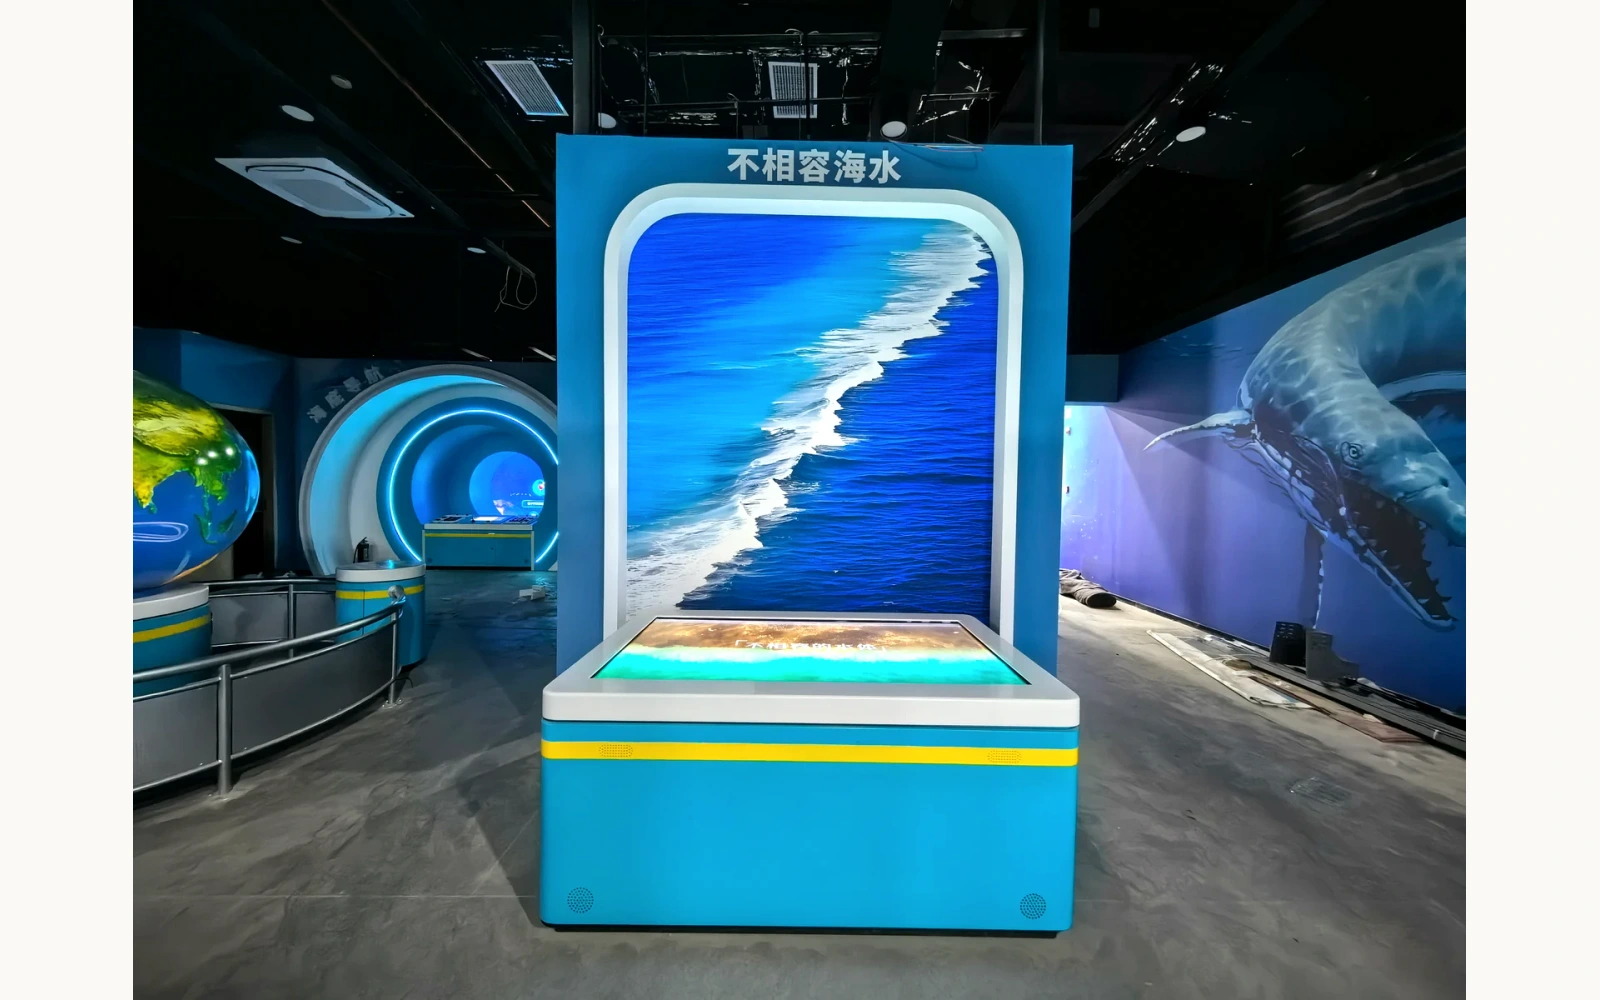
The 28-second silent video records a visitor using a seawater-themed touchscreen console with a separate rear graphic panel.
Identify the interface
Locate the horizontal touchscreen and distinguish it from the rear graphic display.
Follow the interaction
Watch the visitor select and adjust on-screen conditions, then look at the ocean imagery shown on the console.
Separate control from process
Describe the visible input and screen response before discussing the scientific processes the interface is intended to introduce.
About this video reference
This is an interface and interaction demonstration, not a real-water mixing tank experiment. The footage does not measure salinity, temperature, density, flow speed or ocean transport. Scientific mechanisms below come from NOAA sources and conceptual explanation.
01 / EXPLAINING THE IDEA
Begin with several causes, not a single current engine
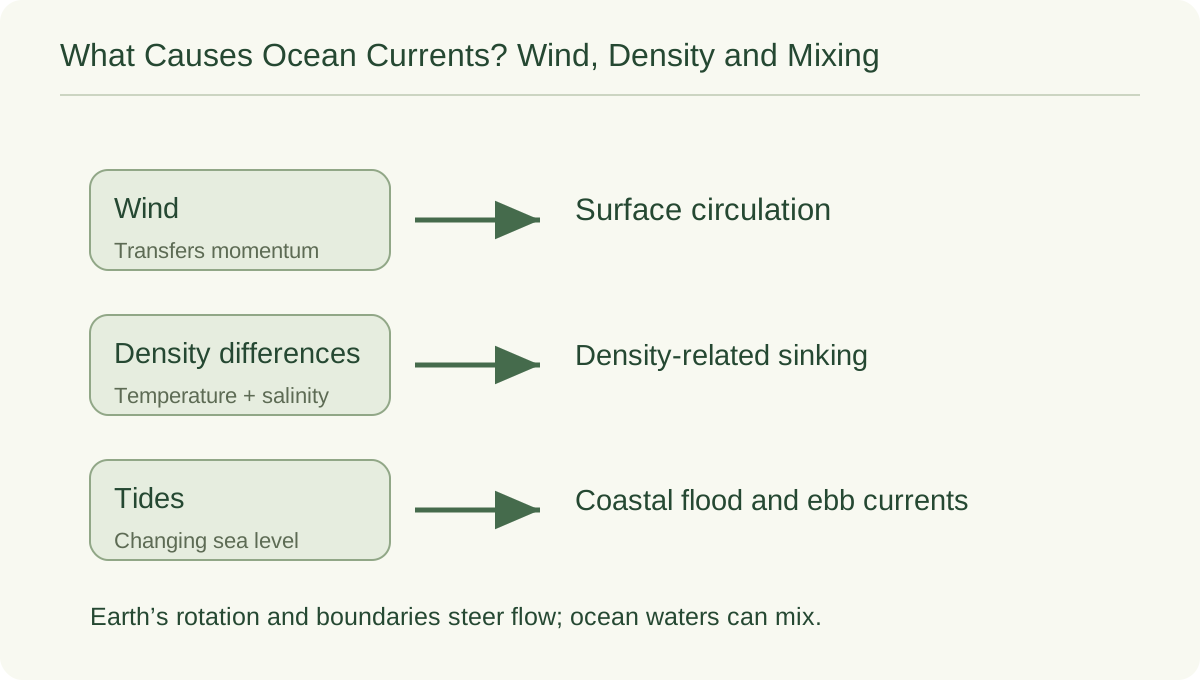
What causes ocean currents depends on the setting. NOAA identifies wind, water density and tides as drivers. Coastlines, seafloor features and Earth's rotation also influence circulation. Distinguish what helps initiate movement from what shapes its route.
Large-scale surface currents transport heat. Tidal currents may reverse, while other flows have a prevailing direction. A map arrow simplifies these differences. Ask what depth, location and period it represents before treating it as a complete picture.[1]
02 / EXPLAINING THE IDEA
Wind and rotation shape surface pathways
Wind acts on the ocean surface and helps set water in motion. Because Earth rotates, moving air and water are deflected relative to the rotating surface: toward the right in the Northern Hemisphere and toward the left in the Southern Hemisphere. NOAA's Coriolis tutorial explains this rotating-frame influence on circulation.
In a concept diagram, draw wind input separately from the curved water path. Label it simplified: wind can drive movement, and rotation shapes the result. Swirling water in a small unrotated container does not automatically reproduce the planetary influence.[2]
03 / EXPLAINING THE IDEA
Temperature and salinity change relative density
Density describes mass in a given volume. For seawater at comparable pressure, colder water is generally denser than warmer water, and increasing salinity generally increases density. Both properties matter together. A warm, salty parcel cannot be ranked against a cool, fresher parcel simply by considering one property and ignoring the other.
NOAA explains thermohaline circulation through temperature and salinity differences. In polar regions, cooling and salt left in surrounding seawater during sea-ice formation can increase density and promote sinking. The useful comparison is with the surrounding water. A label saying only salty water sinks leaves out that relative comparison and the effect of temperature.[3]
04 / EXPLAINING THE IDEA
A boundary can persist while water still mixes
A distinct layer or visible boundary does not prove that two water masses never mix. NOAA's estuary tutorial describes cases in which less dense fresh water lies above saltier water, with the amount of mixing affected by winds, tides, river flow and the shape of the estuary. Layers and mixing can therefore be discussed together.
Use the estuary as a specific coastal example, rather than claiming it explains every ocean front. A color boundary alone does not establish the density, salinity or circulation of the water on either side. Ask what a picture actually records and what measurements would be needed to test an explanation.[4]
05 / EXPLAINING THE IDEA
Read the touchscreen as an explanation interface
The accompanying video shows a physical console being operated. It does not show two real water masses meeting in a transparent tank. The product record identifies a horizontal touchscreen with ocean imagery and a separate rear graphic panel. The video guide describes selecting and adjusting on-screen conditions.
Record the interaction: a visitor makes a selection and the screen responds. Without documented software rules or independent validation, this does not establish accuracy in predicting a real ocean process. Tie the scientific interpretation to NOAA's explanation; do not assign measurements to this video.
06 / EXPLAINING THE IDEA
Use a conceptual diagram to connect the ideas
Prepare a two-part diagram for discussion: a plan view with wind and surface-current arrows, and a vertical section with two water parcels labelled by temperature and salinity. Mark both panels conceptual and not to scale. Invite learners to add relative-density notes before deciding whether a parcel could sink into its surroundings.
Use the table to distinguish three kinds of evidence. This proposed activity adds no claim about functions already installed in the console. Digital imagery can explain a topic without becoming a physical experiment.
| Evidence | What it can establish | What it does not establish alone |
|---|---|---|
| Local operating video | A visitor interacts with a touchscreen | Measured density-driven flow |
| Conceptual diagram | Relationships selected for explanation | Full ocean dynamics or numerical accuracy |
| Ocean observations | Recorded properties at stated places and times | Every current everywhere |
07 / EXPLAINING THE IDEA
Let visitors test an explanation, not just choose a screen
Before the interaction, ask visitors which change they expect to make water relatively denser: cooling it or warming it, with other conditions held comparable. Afterward, ask them to explain their reasoning and identify what the screen actually showed. A facilitator can then introduce a second variable and discuss why changing two properties complicates the comparison.
For an exhibit brief, specify the intended question, the meaning of each control and how the representation handles uncertainty. Provide an accessible written explanation beside the imagery. A useful outcome is a visitor who can name several current drivers and distinguish a scientific concept, an interactive model and a measurement.
Common questions.
Are all ocean currents caused by temperature and salinity?
No. Density differences are important, particularly for deep circulation, but winds and tides also drive currents. Rotation, coasts and seafloor features influence the paths.
Do different-looking water masses refuse to mix?
No. A boundary can remain noticeable while mixing occurs. NOAA's estuary examples show that the degree of mixing depends on several physical conditions; an image alone does not quantify them.
Does the seawater console video prove density-driven circulation?
No. It documents a visitor using an explanatory touchscreen. The density and circulation discussion is supported by NOAA sources, not by measurements of real water in that footage.
SCIENCE & FURTHER READING
Follow the sources.
Read the original scientific explanations and teaching resources behind this article.
- NOAA Education — Ocean currents
Wind, tides, density, geographic influences and the distinction between surface and deep circulation.
- NOAA National Ocean Service — The Coriolis Effect
Rotating-Earth deflection and its relationship with winds and surface currents.
- NOAA National Ocean Service — Thermohaline Circulation
Temperature, salinity, relative density and sinking in a simplified deep-circulation explanation.
- NOAA National Ocean Service — Classifying Estuaries: By Water Circulation
Specific coastal examples of layering and mixing, influenced by wind, tides, geometry and river flow; not a universal account of all ocean fronts.
Editorial: Exhibit Engineers science & exhibit team. Scientific references are cited for the explanations; product configuration details follow the linked exhibit records.